
Turnaround Time
Turnaround Time (TAT) Analytics allows users to perform the following functions:
- Monitor laboratory TAT metrics at several processing stages (requisitions, workflows, and reporting)
- Filter, sort, and analyze laboratory data for compliance
- Export laboratory data to monitor operational efficiencies
In OvDx LIMS, users with the TAT permission can use the Turnaround Time Dashboard to review all data within the organization. Users can further examine specific data for Pre-Analytical, Analytical, and Post-Analytical steps of processing. In this article, we review the capabilities and functions of each tab within Turnaround Time Analytics. Read the entire article or skip to your section of interest.
Feature Review
This section reviews the required permissions needed to access the TAT Feature, defines the four tabs contained within the feature, and explains the Global Filters.
User Permissions
There are two permissions required to view the Turnaround Times feature; Analytics and TAT. The Analytics permission should be set to Read, Write or Admin to enable the tab across the top of the screen. To access the drop-down of Turnaround Times under the Analytics tab, users must have a role with the TAT Permission set to Read, Write or Admin Permission Level. All permission levels are equivalent and allow complete access to TAT Analytics.
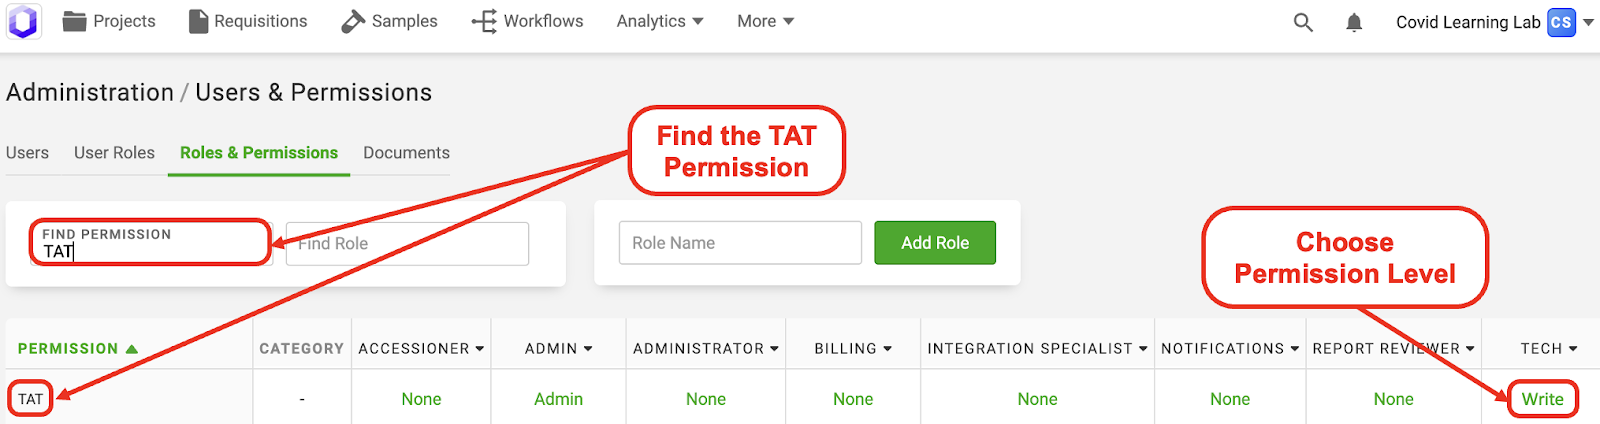
Note: Users with a Role assigned any Permission Level for “TAT” will see metrics about all Projects within your LIMS. However, Users cannot click through to the details of any Projects unless they are added as a User to that Project. Therefore, to prevent unwanted viewing of all Project metrics, we recommend only turning on TAT access for Roles where Users are added to all Projects (i.e., Lab Manager Role).
See our Roles and Permissions Article to navigate to the Users and Permissions Page and determine if you have the appropriate permission.
Turnaround Time Analytics Tabs
TAT Analytics has four tabs where you can examine data.
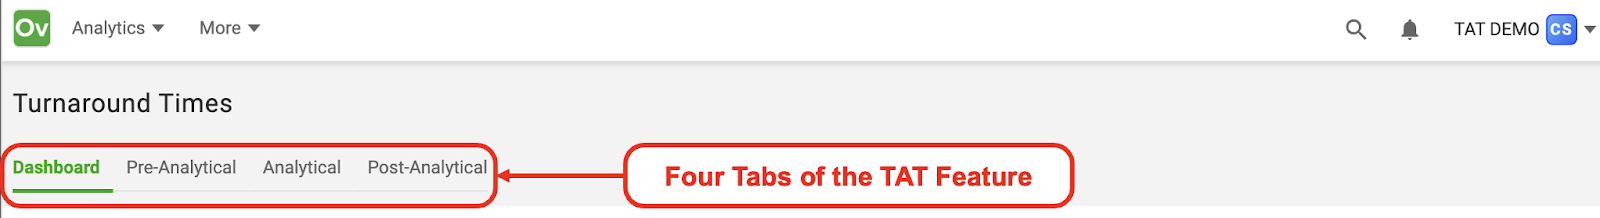
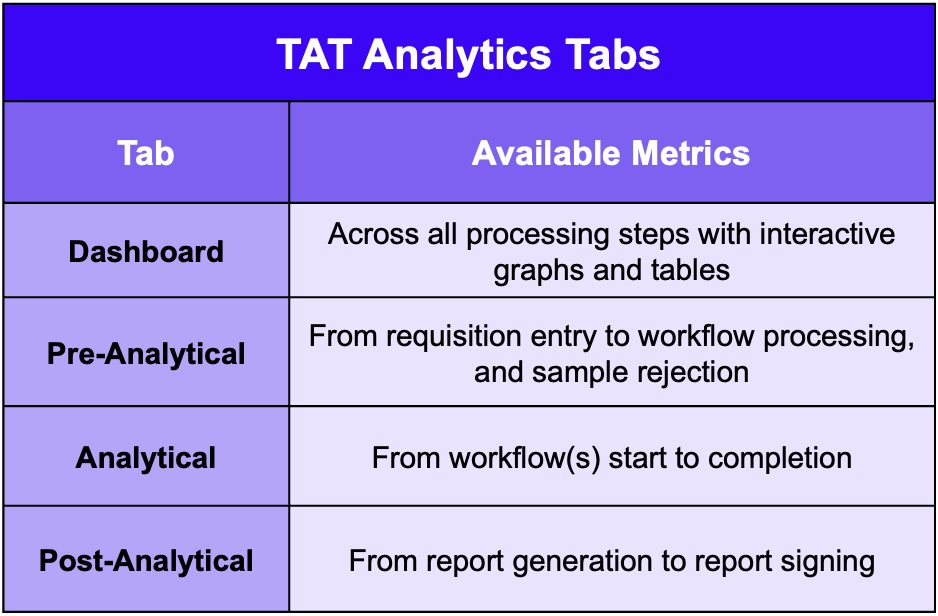
The four tabs, found at the top of the page, are defined below.
Global Filters
Additionally, every page has the same Global Filters at the top. Global Filters are reviewed below.
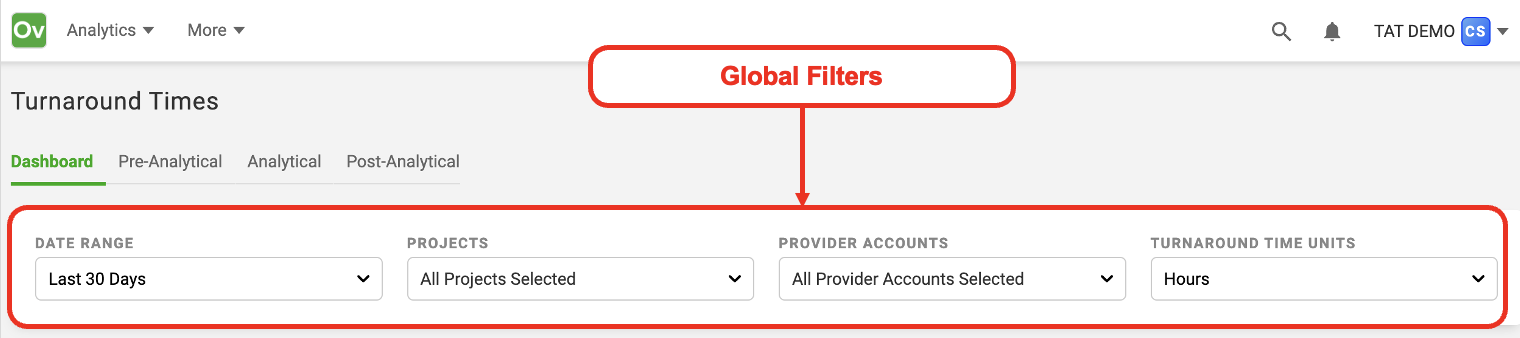
Note: Global Filters are persistent during a user session and will apply to all tabs within the TAT Feature until users clear them
1. Click the Date Range drop down menu to choose your desired Date Range
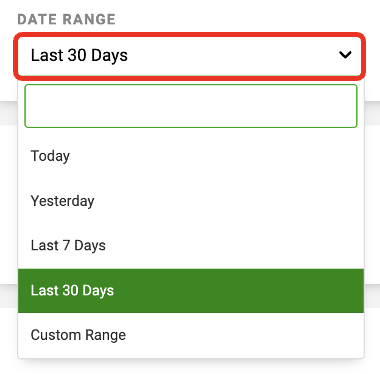
Tip: The Date Range defaults to the past 30 days
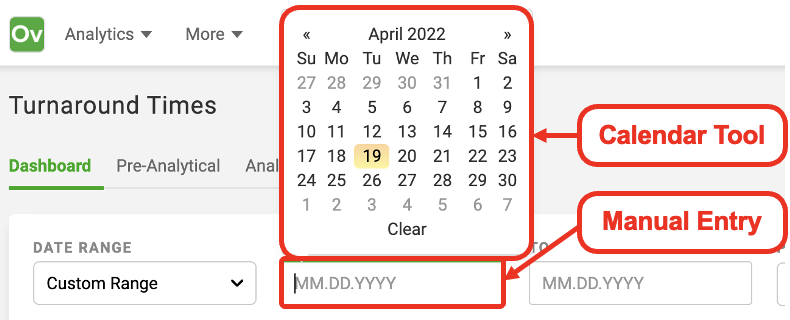
2. Optional: If using a Custom Date Range, select the dates using the Calendars or by manually entering the date
3. Click the Projects dropdown menu and select the Project(s) you wish to analyze
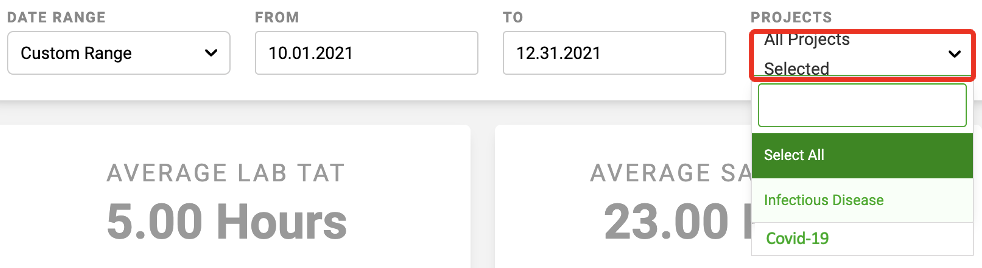
Tip: Multiple projects can be selected in the dropdown menu. The dropdown menu can also be filtered by typing in the search bar
4. Click the Providers dropdown menu and select the Provider(s) you wish to analyze
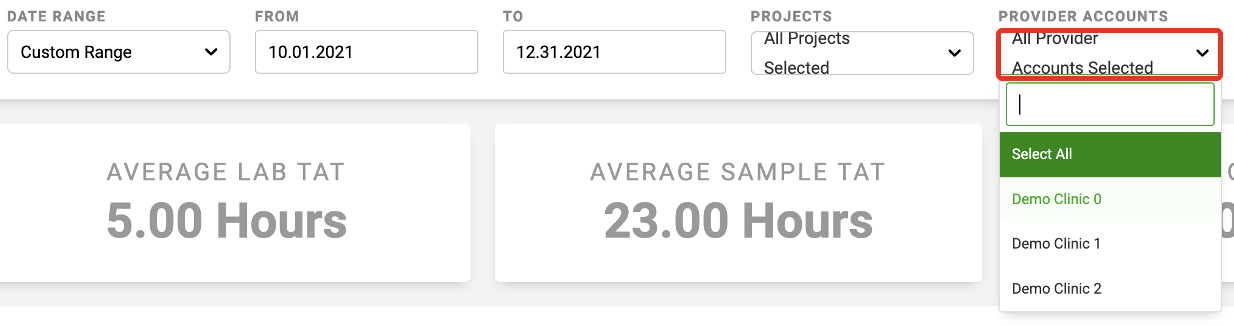
Tip: Multiple providers can be selected in the dropdown menu. The dropdown menu can also be filtered by typing in the search bar
5. Choose to display the Turnaround Time Units in hours or days
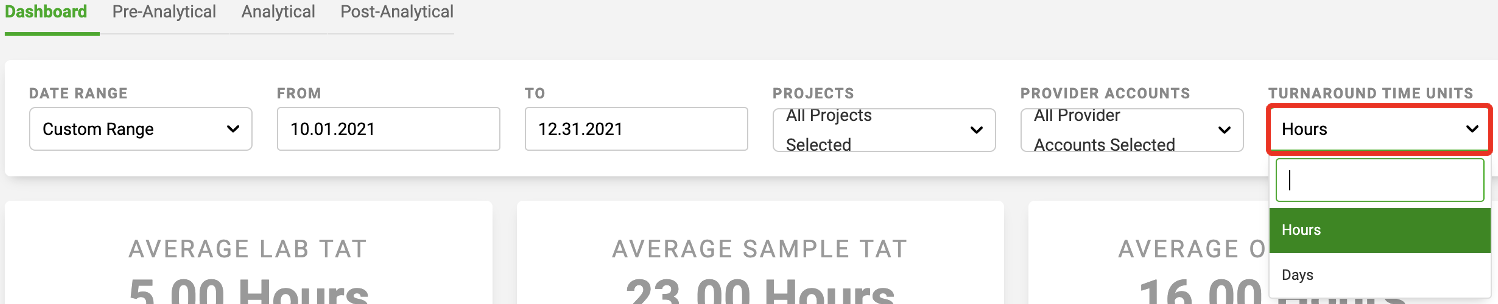
Note: Hours are rounded to the nearest whole hour
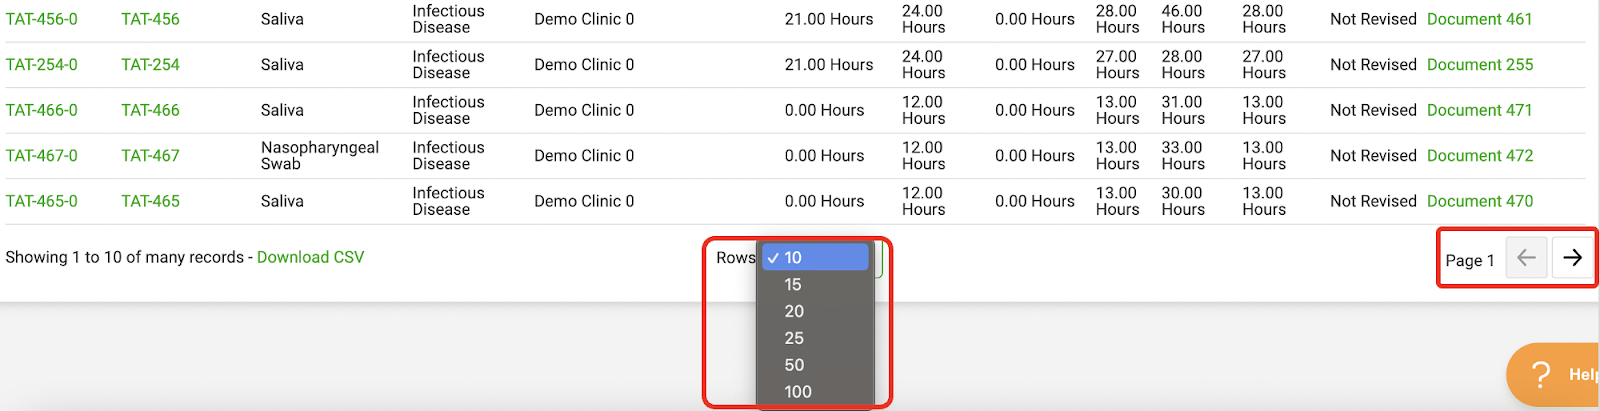
Adjusting Table Displays
Up to 100 records can be displayed per page of any table. Click the Rows dropdown to select your maximum number of displayed records per page. Use the page arrows to navigate through data records
Dashboard Tab
The Dashboard tab is the main landing page of the TAT Analytics Feature. This page contains Average TAT Key Performance Indicators (KPIs), interactive graphs, and the overall Turnaround Time Table.
Example Use Cases
The Dashboard Tab can be used to help maintain compliance with accreditation entities (ex. CAP) and to understand and support internal operational metrics for improved efficiency. These goals can be met by monitoring monthly, weekly, and daily changes in results from this tab. Monthly, weekly, and daily use cases are listed in the tables below to highlight examples for operational metrics monitoring.
Note: The Metric Calculations in the tables below are calculated based on the Global Filter settings. Changing the Global Filters will alter the calculation results
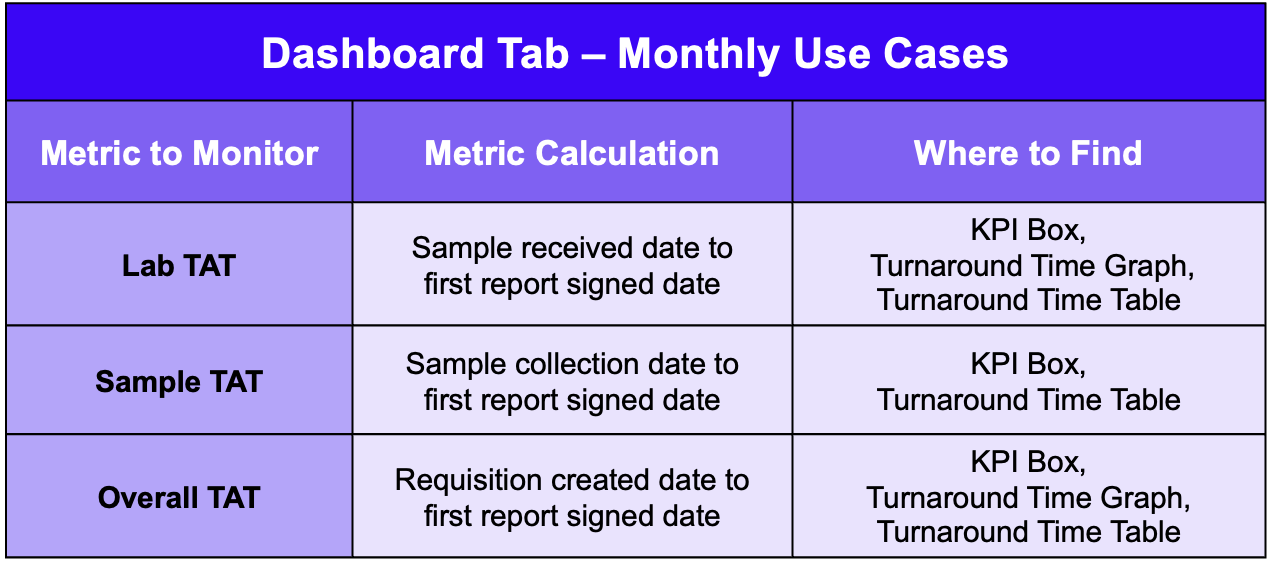
Monthly Metrics to Monitor
Weekly Metrics to Monitor

Daily Metrics to Monitor

Key Performance Indicators (KPIs)
The KPI boxes at the top of the page are shown below. The Dashboard Tab contains the KPIs of AVERAGE LAB TAT, AVERAGE SAMPLE TAT, and AVERAGE OVERALL TAT.

Tip: Hovering over the KPI will display the calculation definitions
Note: "Reported Date" used to calculate all TAT KPIs refers specifically to the original date of report signing; revised reports signed dates are not used in this calculation
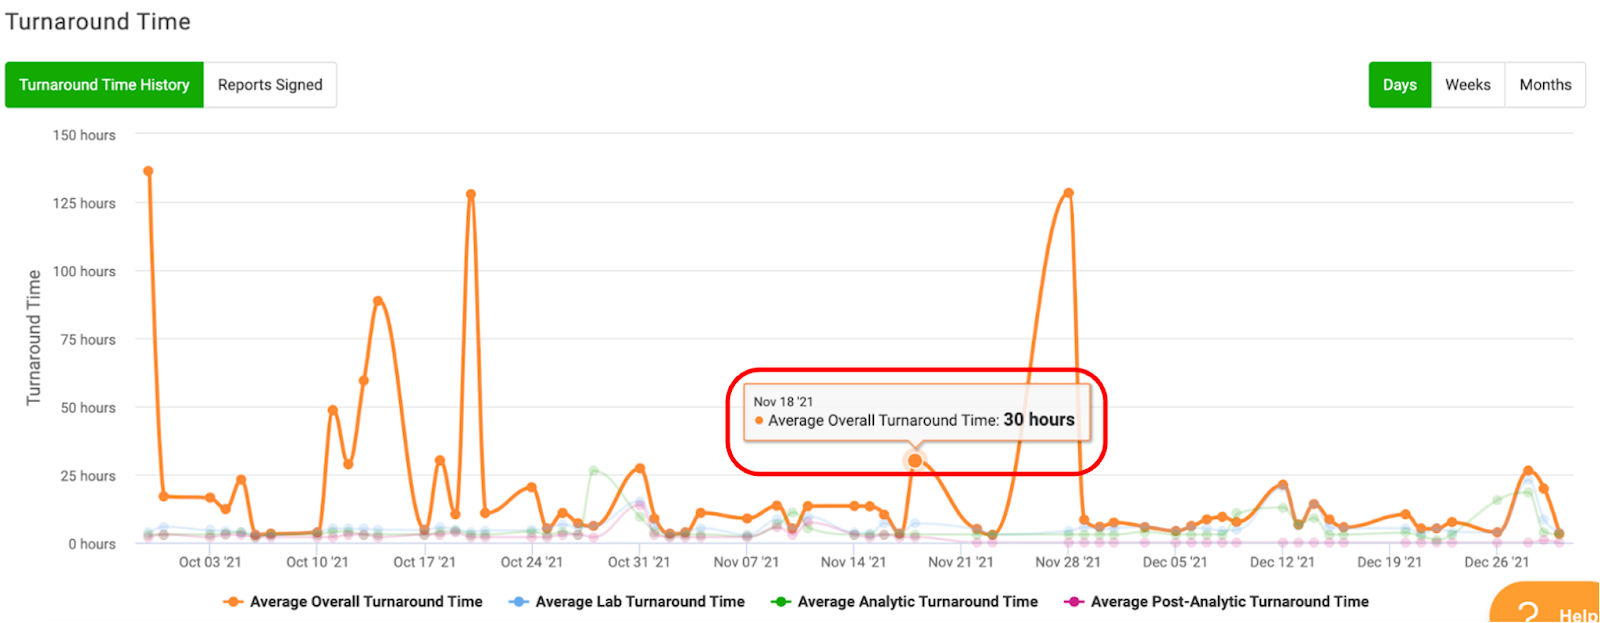
Turnaround Time Graph
The Turnaround Time Graph is interactive and can be used to examine many levels of processing data through selection and deselection of graph components.
The graph defaults to display days for Turnaround Time History within your selected Global Filter Date Range.

The X-axis defaults to display in days, and the Y-axis is Turnaround Time hours. There are also four lines that represent different TAT metrics that you can interact with on the graph. Definitions for the 4 lines are shown below.
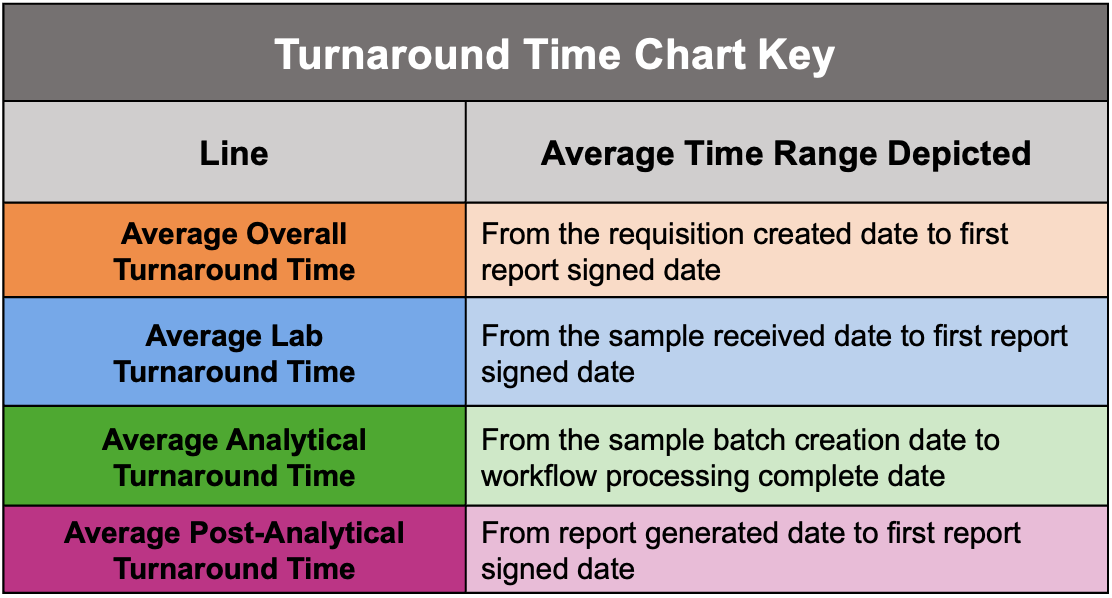
Note: “Requisition Created Date” refers to requisition date of creation in the OvDx LIMS
There are two ways to interact with the chart:
- Hovering over points on the line to see expanded details for that point (hours/days)
- Deselecting/reselecting different TAT lines to adjust the displayed data. The chart Y-axis scale will automatically adjust
Hovering:
Deselecting:
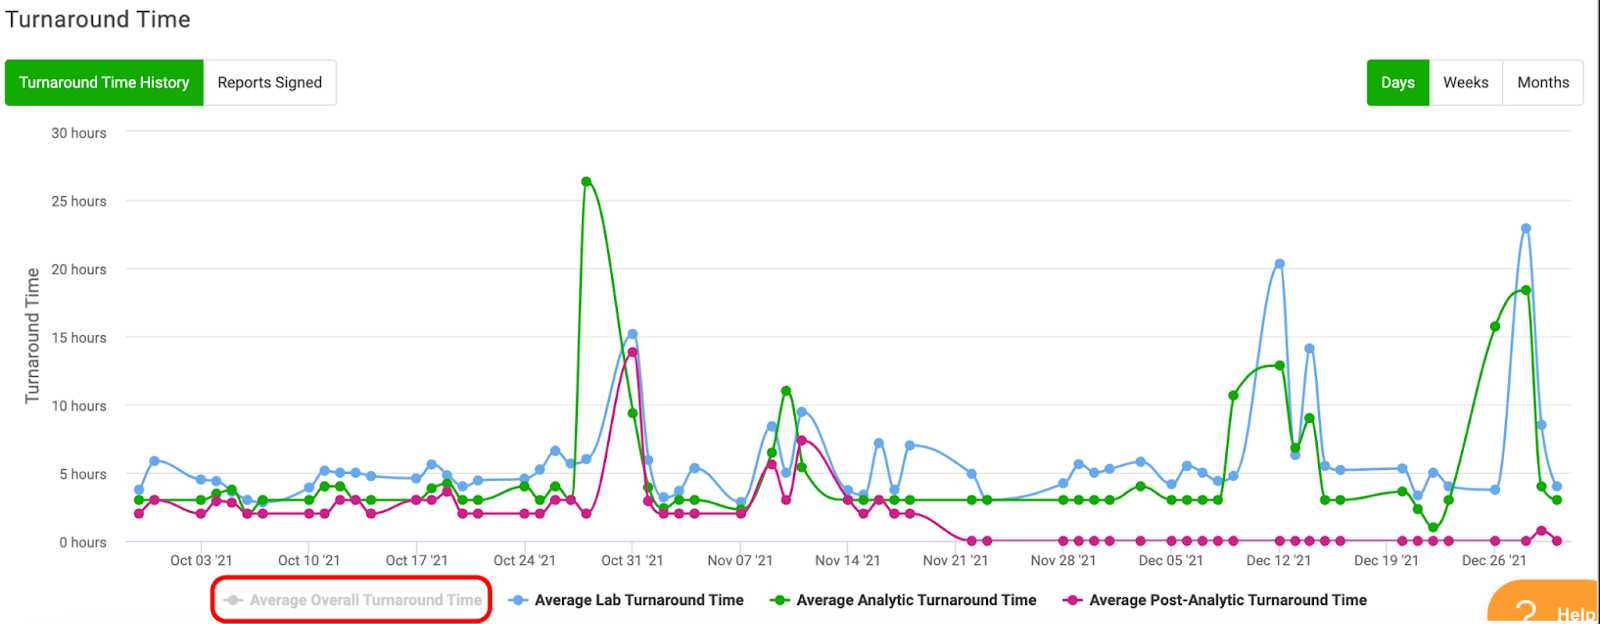
Tip: Deselect/reselect legends to change the chart display and investigate trends within other line metrics
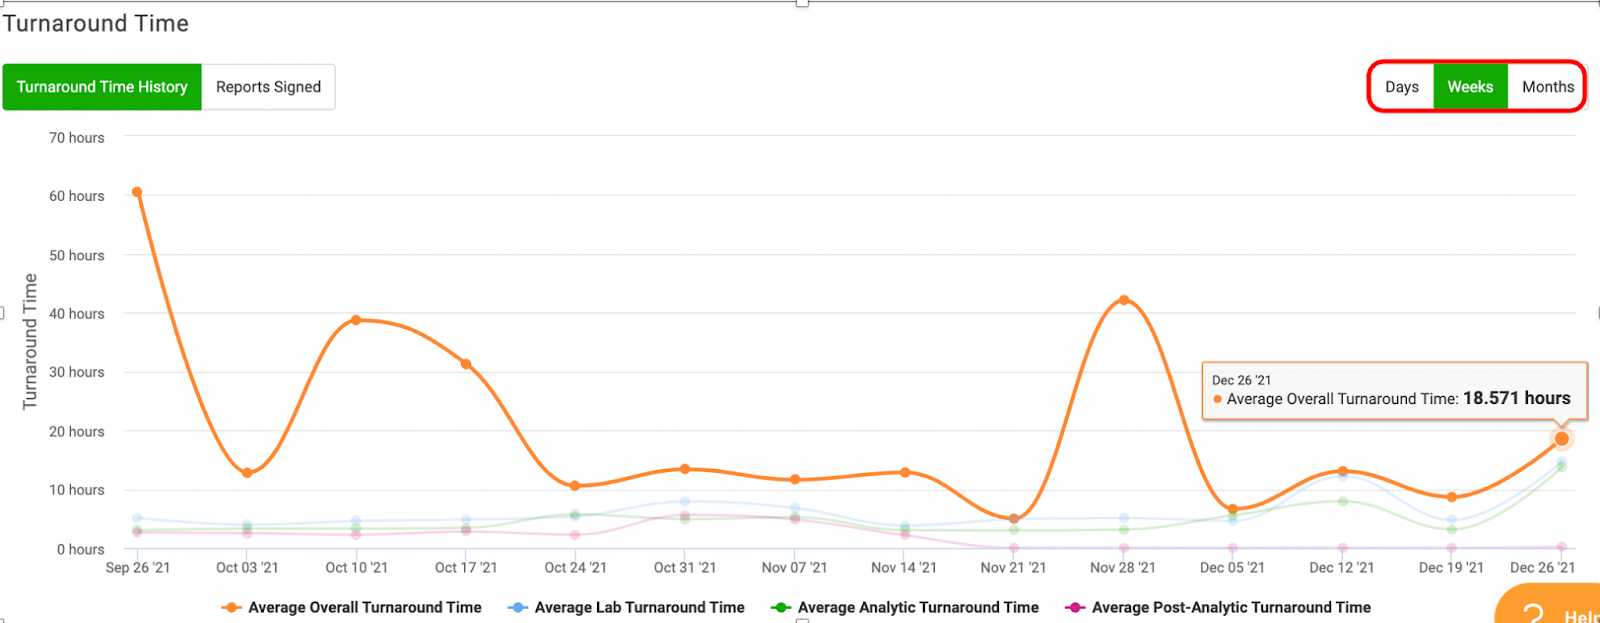
The X-axis scale can be changed from days to weeks or months. Again, the chart will automatically adjust the display upon selection.
Click “Reports Signed” to see the report signing metrics.
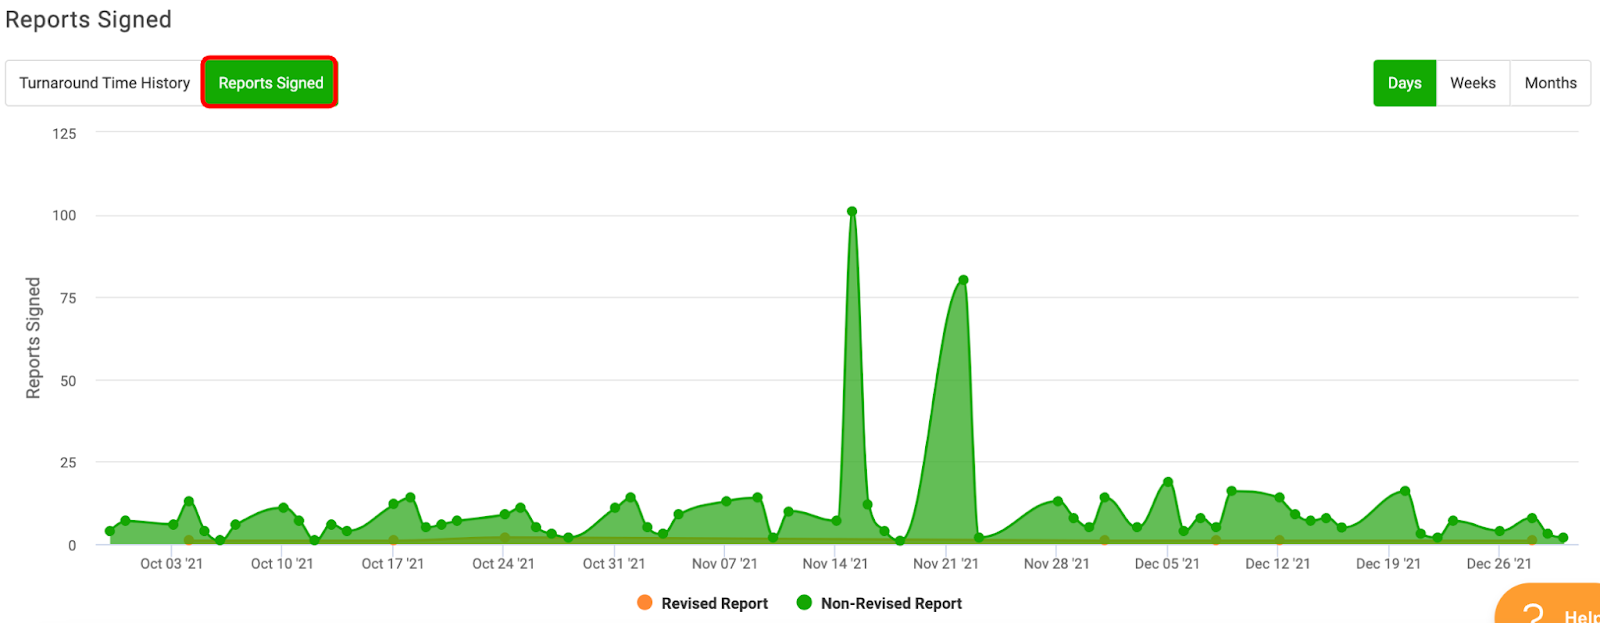
Tip: Hover to inspect data points or deselect/reselect legends to view Revised or Non-Revised Reports only
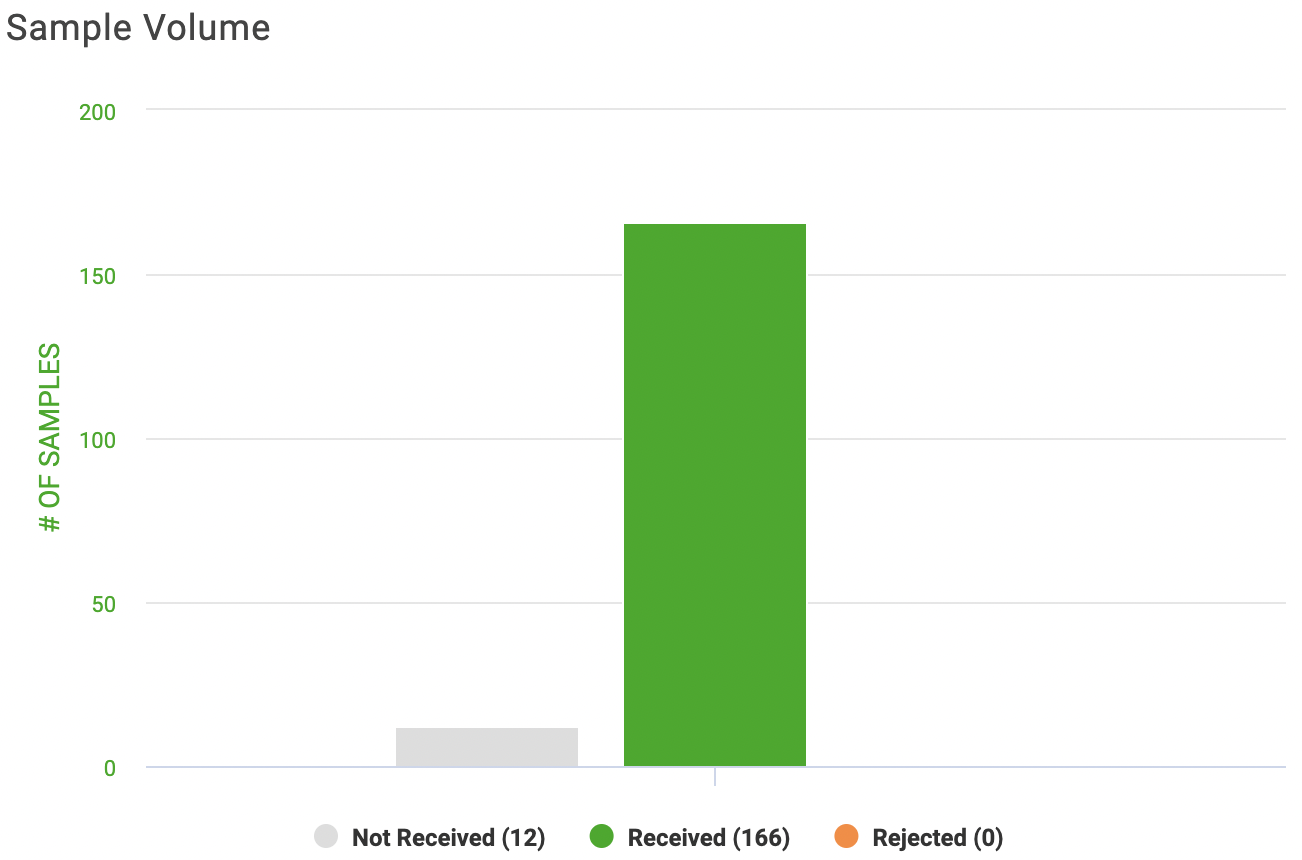
Sample Volume Bar Graph
The Sample Volume Bar Graph shows the total numbers of Not Received, Received, and Rejected Samples within the Global Filtered Date Range.
There are two ways to interact with the chart:
- Hovering over bars to see the total number for that group
- Deselecting/reselecting legends to adjust the displayed data. The chart Y-axis scale will automatically adjust
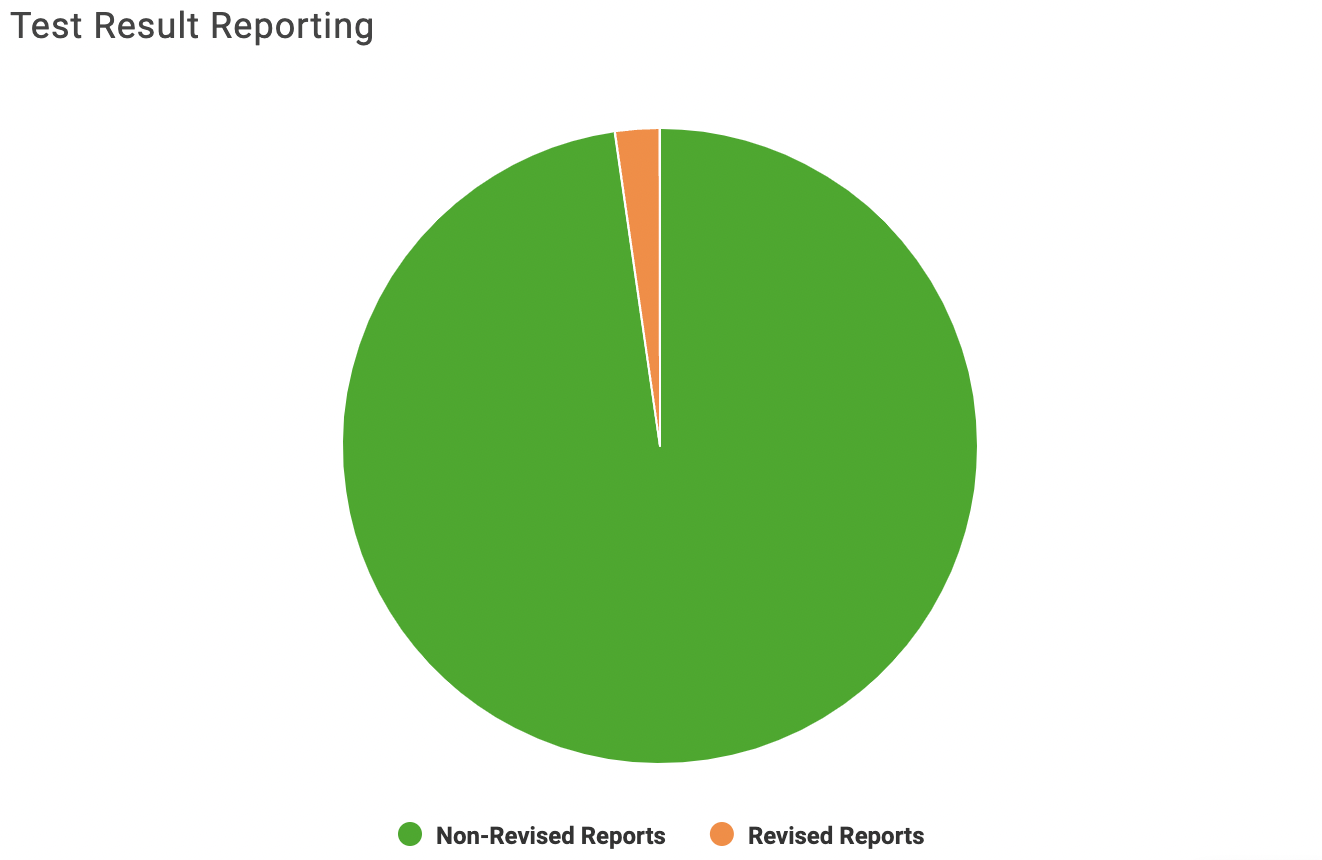
Test Reporting Result Pie Chart
The Test Reporting Result Pie Chart shows the proportion of non-Revised and Revised Reports within your selected Global Filter Date Range.
The chart can be interacted with by…
- Hovering over sections of the pie chart to reveal the percent and total number for that report type
Turnaround Time Table
Note: Samples will only display in the table if a report is present for that record
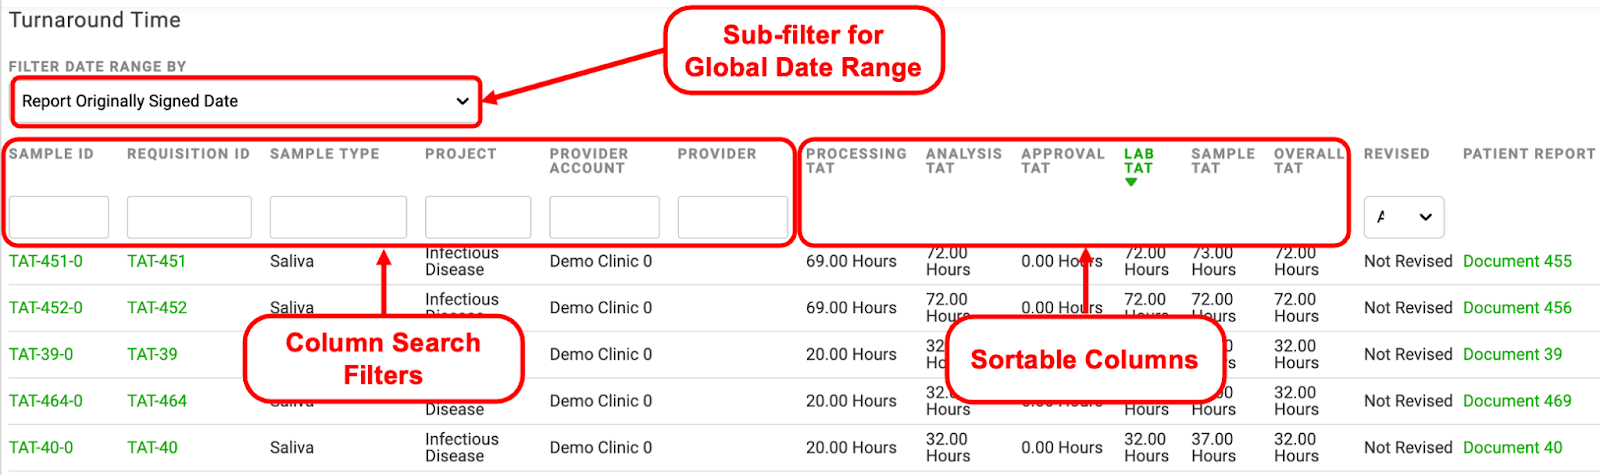
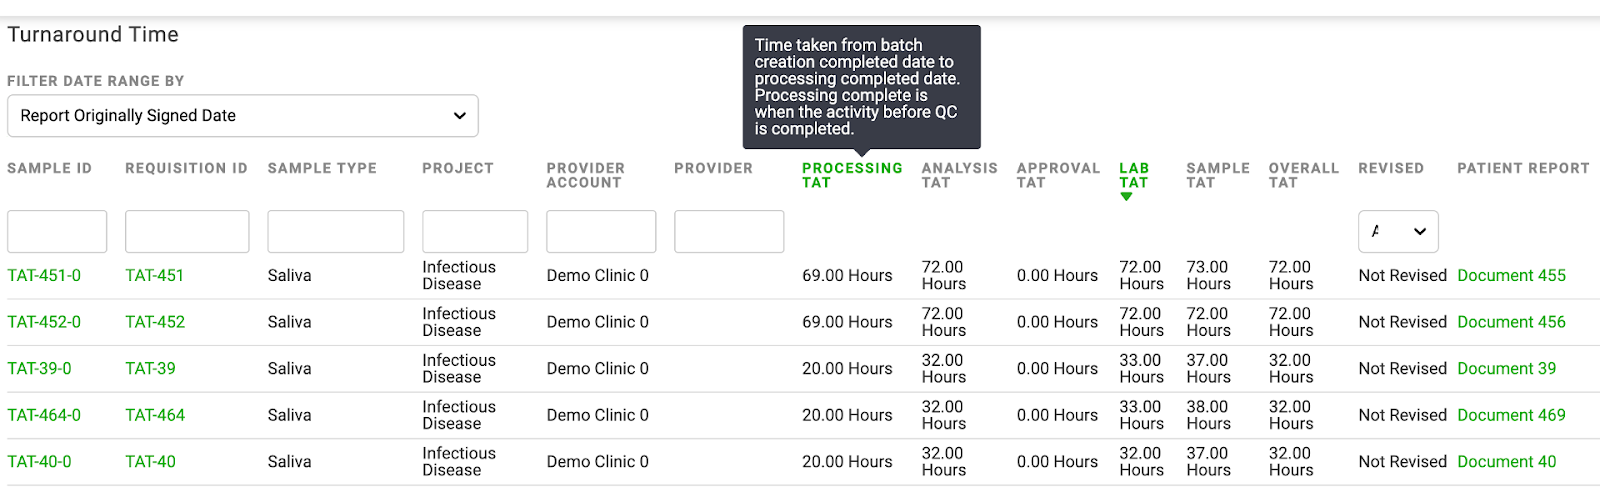
The Turnaround Time Table at the bottom of the Dashboard page allows users to filter and sort the data within the Global Filtered Date Range. To view relevant metrics in the table, you can use the:
- FILTER DATE RANGE BY drop-down sub-filter
- Column search filters
- Sortable columns
- REVISED drop-down filter
- Download CSV link
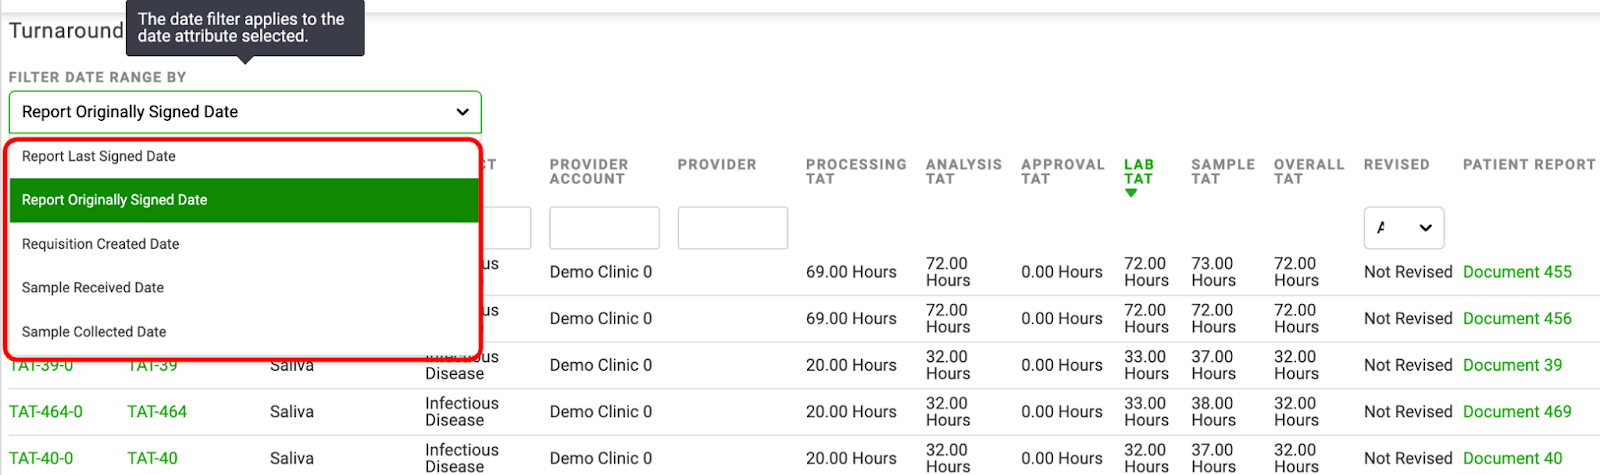
Sub-filter FILTER DATE RANGE BY:
The sub-filter has the following available data constraints that you can use to filter the returned data:
- Report Last Signed Date
- Report Originally Signed Date (default display)
- Requisition Created Date
- Sample Received Date
- Sample Collected Date
Column Search Filters
Click into the search box for the column you wish to filter and type your search query. The results will automatically reload to display on the screen.

Sortable Columns
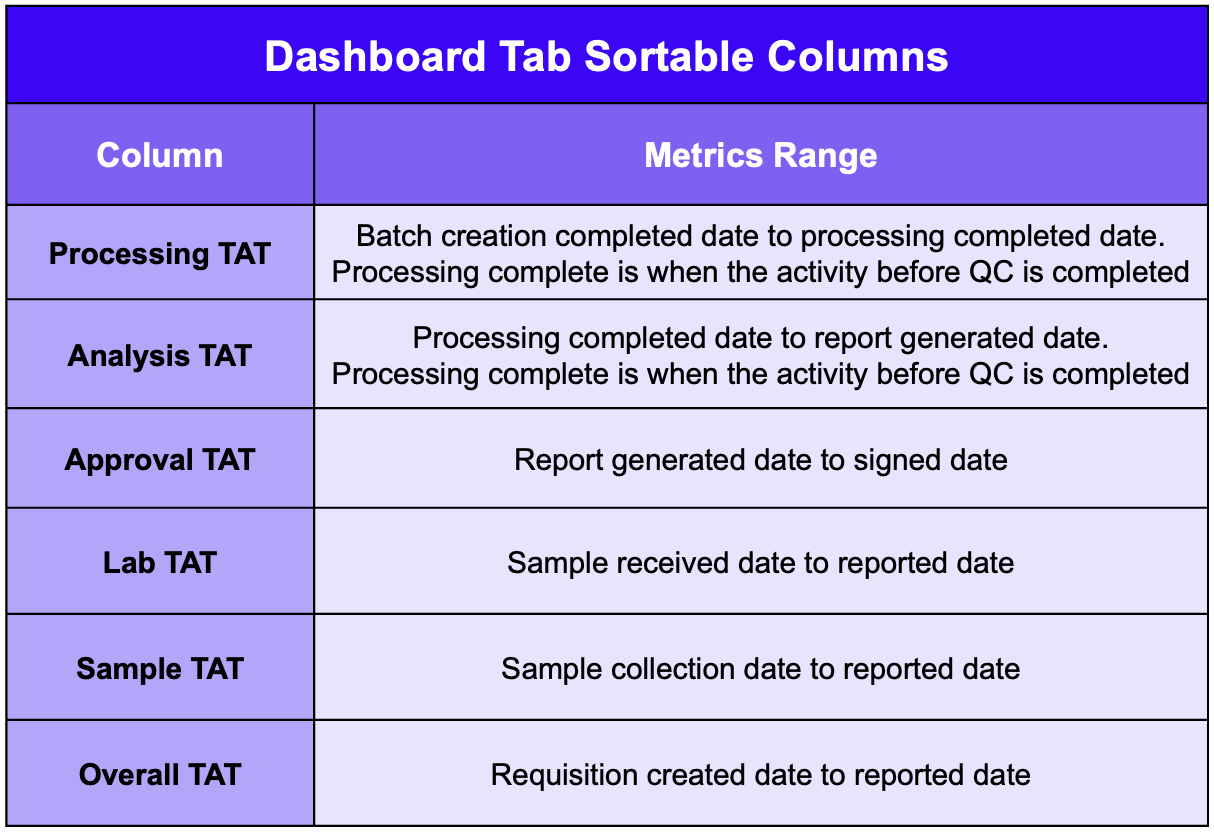
There are six sortable columns in the Dashboard Turnaround Time Table (see summary table shown below):
1. Processing TAT
2. Analysis TAT
3. Approval TAT
4. Lab TAT
5. Sample TAT
6. Overall TAT
Click on the Arrows at the end of the sortable columns for the data to redisplay
- Arrow Up: least to greatest
- Arrow Down: greatest to least

Tip: Definitions for each Sortable Column can be seen by hovering over the column in question. A summary table is also shown below
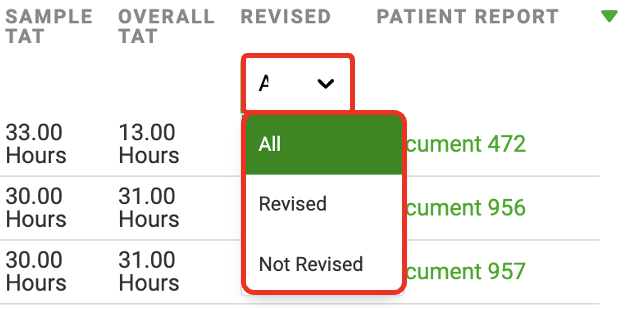
Sorting by Report Type
You can filter the table results to display:
- All Reports (default)
- Revised Reports
- Non-Revised Reports
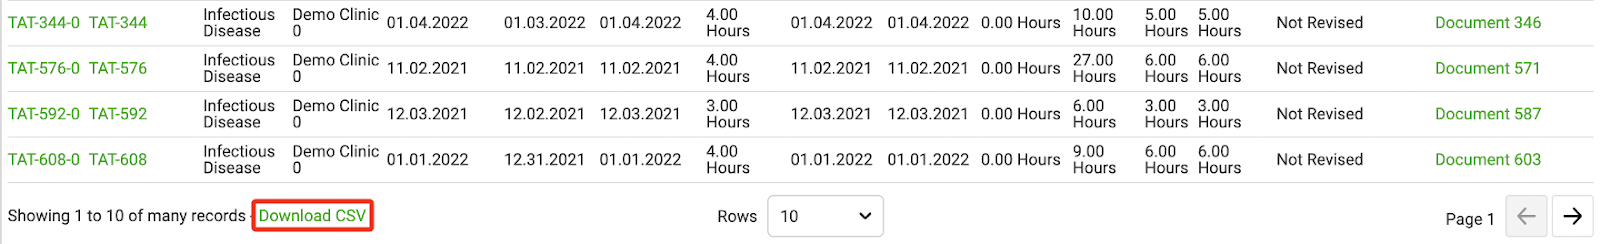
Download Data via CSV
Download all table data within the Global Filtered Date Range by clicking the “Download CSV” option at the bottom of the table.
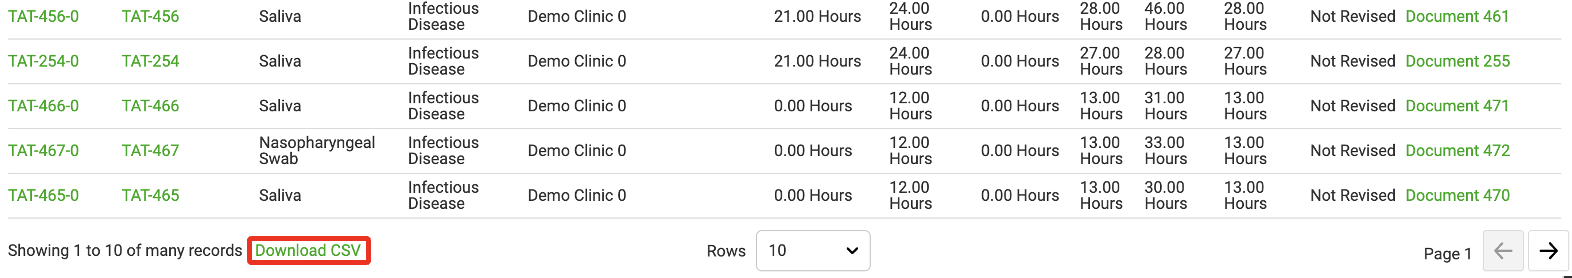
Note: The CSV download will include all data that falls within the Global Filtered Date Range. However, the generated CSV does not include any column sorting or filtering.
Pre-Analytical Tab
The Pre-Analytical Tab defaults to display records that have a Sample Received Date that falls within the Global Filtered Date Range, but that have not yet begun processing. This tab contains Pre-Analytical Key Performance Indicators (KPIs), and two data tables; 1. Pre-Analytical Turnaround Time Table 2. Sample Rejection Details Table.
Example Use Cases
The Pre-Analytical Tab can be used to maintain compliance with accreditation entities (ex. CAP). The tab can also be used to understand and support internal operational metrics for improved efficiency. These goals can be met by monitoring monthly, weekly, and daily changes in results from this tab. Monthly, weekly, and daily use cases are listed in the tables below to highlight examples for operational metrics monitoring.
Note: The Metric Calculations in the tables below are all calculated within the selected Global Filters. Changing the Global Filters will alter the calculation results
Monthly, Weekly, and Daily Metrics to Monitor

Key Performances Indicators (KPIs)
The KPI boxes at the top of the page are shown below. The Pre-Analytical Tab contains the KPIs of REQUISITIONS CREATED, SAMPLES RECEIVED, and SAMPLES REJECTED.

Pre-Analytical Turnaround Time Table
The Pre-Analytical Turnaround Time Table in the middle of the page allows users to filter and sort the data within your selected Global Filter Date Range. Within the table, there is a sub-filter FILTER DATE RANGE BY, columns search filters, and sortable columns. Finally, you may export all data via CSV.
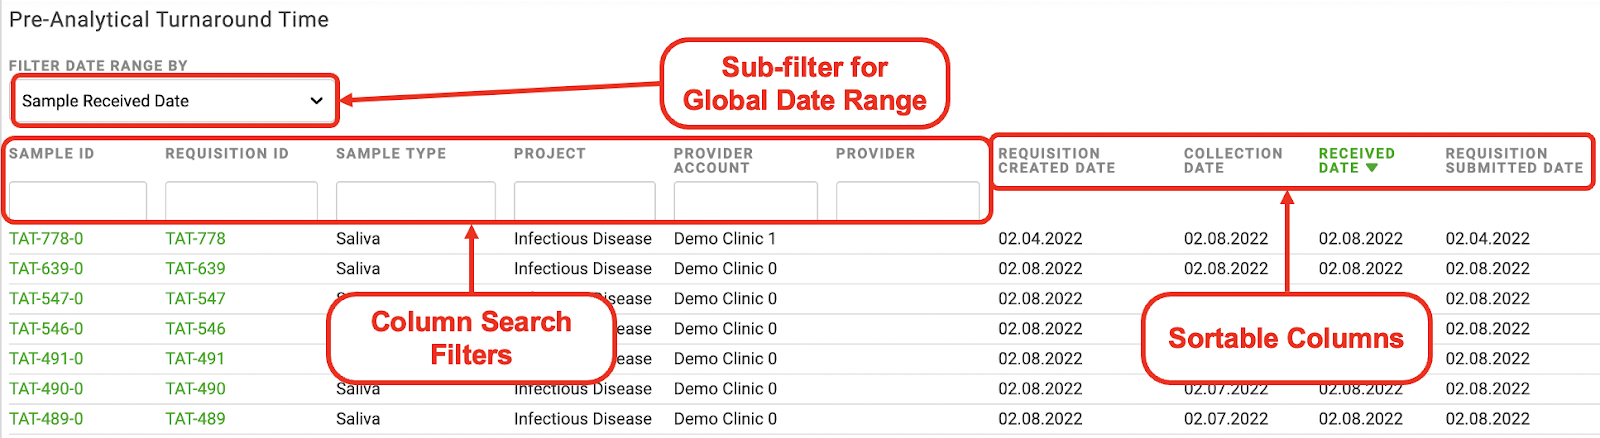
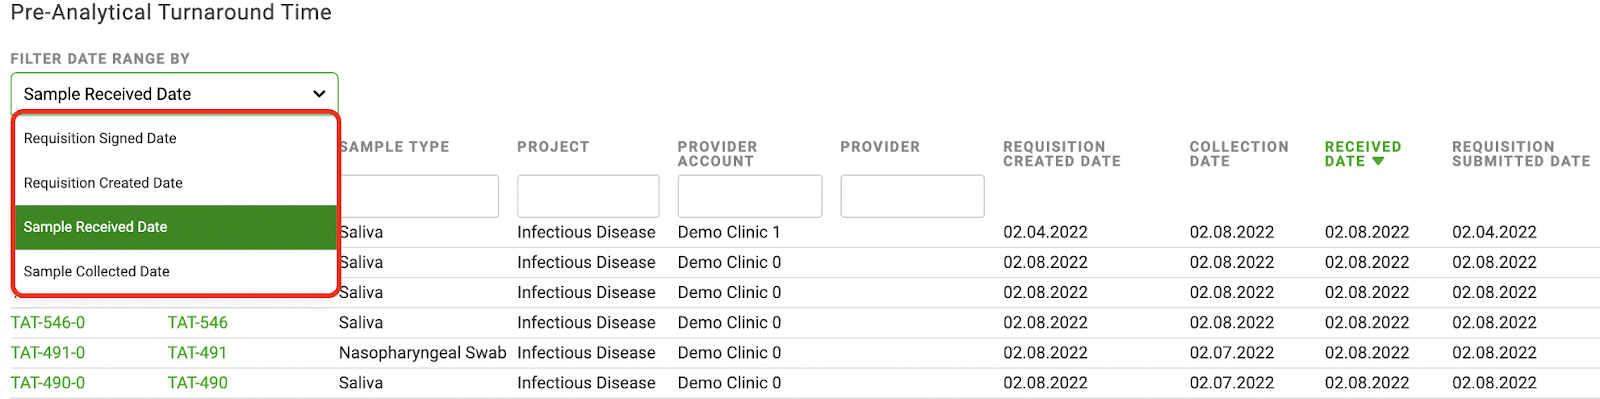
Sub-filter FILTER DATE RANGE BY:
The sub-filter has the following available data constraints that you can use to filter the returned data:
- Requisition Signed Date
- Requisition Created Date
- Sample Received Date (default)
- Sample Collected Date
Column Search Filters
Click into the search box for the column you wish to filter and type your search query. The results will automatically reload to display on the screen.

Sortable Columns
There are four sortable columns in the Pre-Analytical Turnaround Time Table:
1. Requisition Created Date
2. Collection Date
3. Received Date
4. Requisition Submitted Date
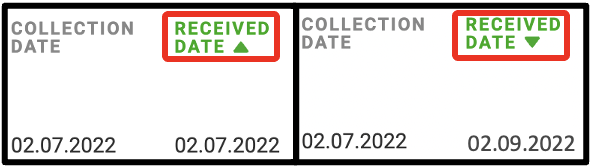
Click on the Arrows at the end of the sortable columns for the data to redisplay
- Arrow Up: least to greatest
- Arrow Down: greatest to least

Download Data via CSV
Download all table data within the Global Filtered Date Range by clicking the “Download CSV” option at the bottom of the table.

Note: The CSV download will include all data that falls within the Global Filtered Date Range. However, the generated CSV does not include any column sorting or filtering.
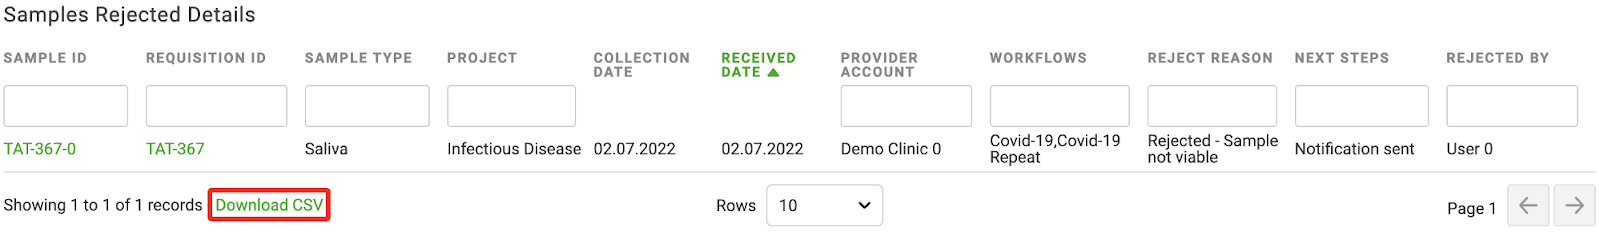
Samples Rejected Details Table
The Samples Rejected Details Table at the bottom of the page allows users to filter and sort the data within the Global Filtered Date Range. This table displays samples that were rejected prior to Workflow Processing (samples not yet used in a Batch Creation Activity Step). Within the table, there are column search filters, and sortable columns. Finally, you may export all data via CSV.
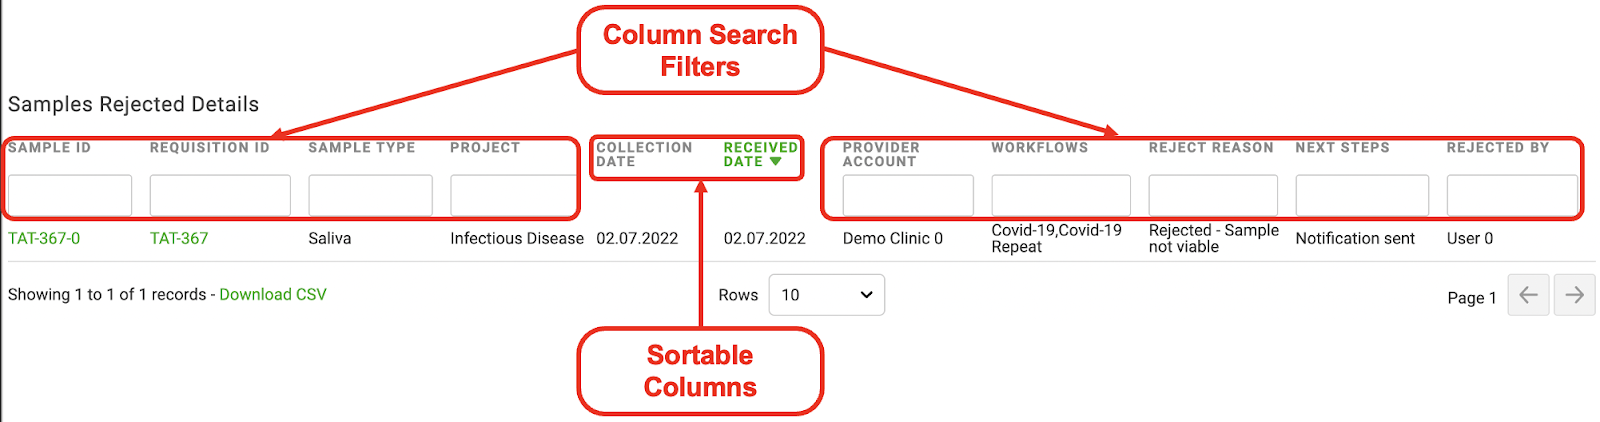
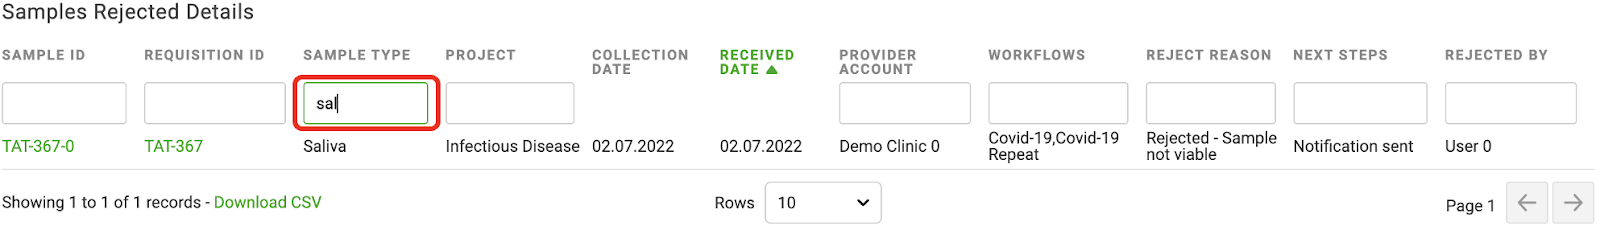
Column Search Filters
Click into the search box for the column you wish to filter and type your search query. The results will automatically reload to display on the screen.
Sortable Columns
There are two sortable columns in the Samples Rejected Details Table:
1. Collection Date
2. Received Date
Click on the Arrows at the end of the sortable columns for the data to redisplay
- Arrow Up: least to greatest
- Arrow Down: greatest to least
Download Data via CSV
Download all table data within the Global Filtered Date Range by clicking the “Download CSV” option at the bottom of the table.
Note: The CSV download will include all data that falls within the Global Filtered Date Range. However, the generated CSV does not include any column sorting or filtering.
Analytical Tab
The Analytical Tab displays records where the Workflow Processing Complete Date falls within the Global Filtered Date Range. This page contains Analytical Key Performance Indicators (KPIs) and the Analytical Turnaround Time Table
Example Use Cases
The Analytical Tab can be used to help maintain compliance with accreditation entities (ex. CAP) and to understand and support internal operational metrics for improved efficiency. These goals can be met by monitoring monthly, weekly, and daily changes in results from this tab. Monthly, weekly, and daily use cases are listed in the tables below to highlight examples for operational metrics monitoring.
Note: The Metric Calculations in the tables below are all calculated within the selected Global Filters. Changing the Global Filters will alter the calculation results
Monthly, Weekly, and Daily Metrics to Monitor
Key Performance Indicators (KPIs)
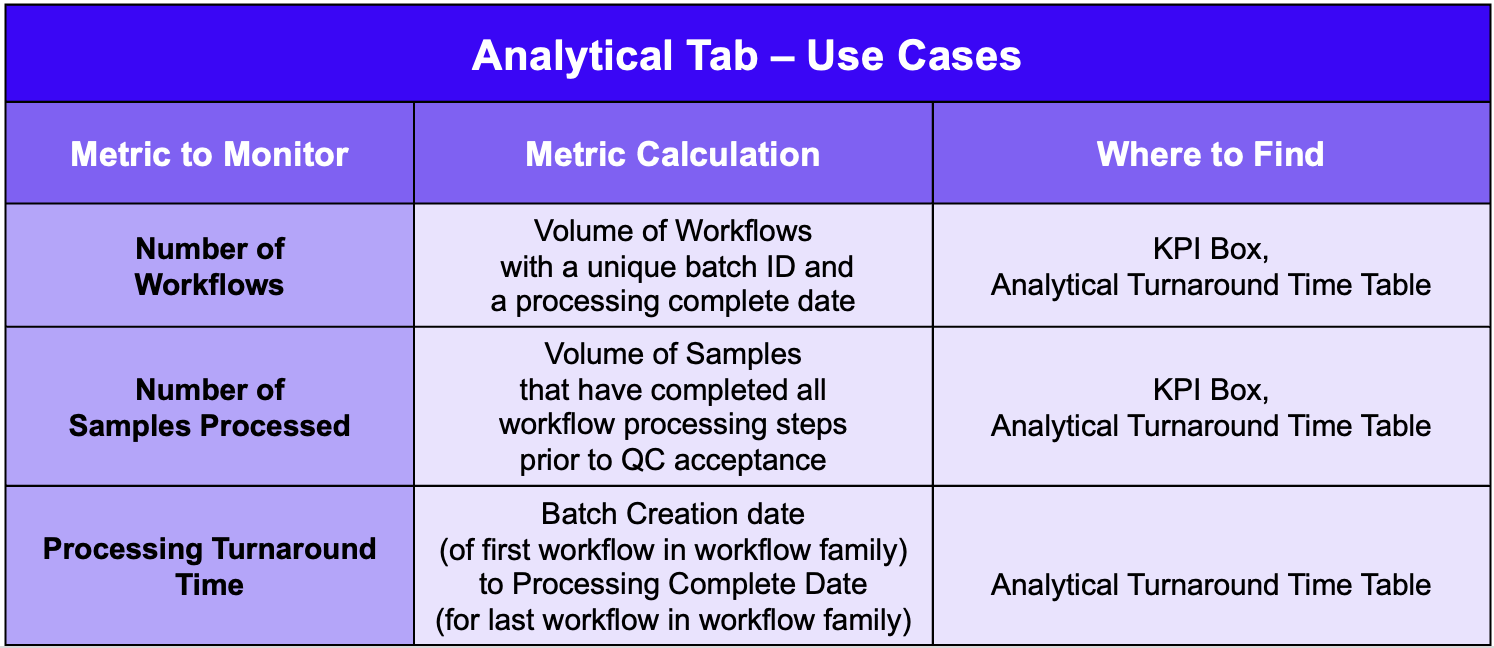
The KPI boxes at the top of the page are shown below. The Analytical Tab contains the KPIs of WORKFLOWS and SAMPLES PROCESSED.
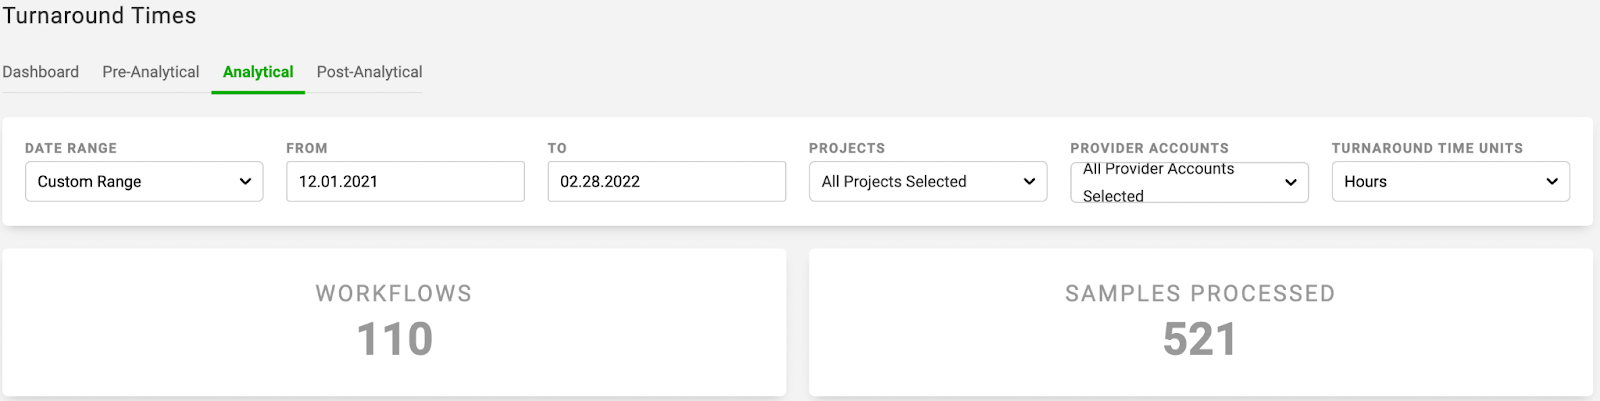
Workflows displays the number of Workflows with a unique batch ID within the Global Filtered Date Range. Samples Processed displays the total number of samples processed within the Global Filtered Date Range.
Analytical Turnaround Time Table
The Analytical Turnaround Time Table in the middle of the page allows users to filter and sort the data within the Global Filtered Date Range. Within the table, there are column search filters, and one sortable column. Finally, you may export all data via CSV.
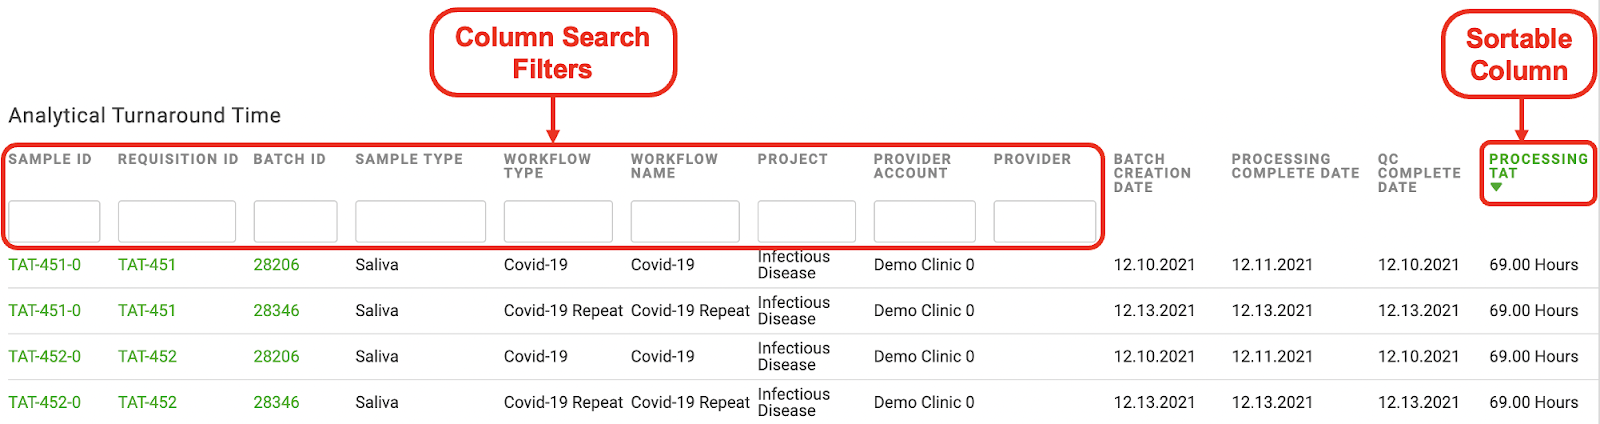
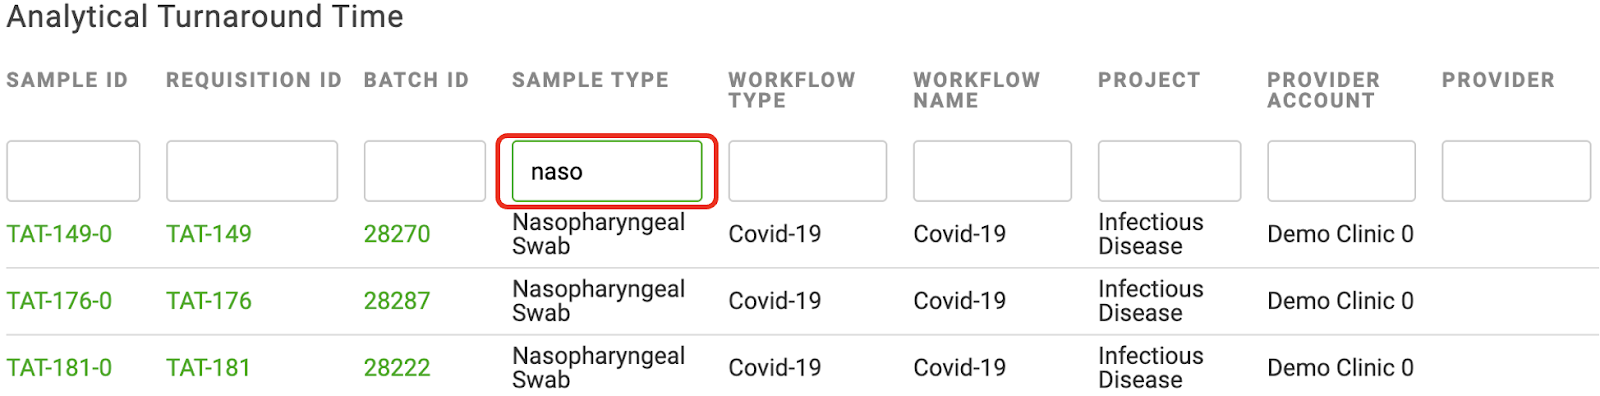
Column Search Filters
Click into the search box for the column you wish to filter and type your search query. The results will automatically reload to display on the screen.
Sortable Column
There is only one sortable column on the Analytical Turnaround Time Page: Processing TAT
Click on the Arrows at the end of the sortable column for the data to redisplay
- Arrow Up: least to greatest
- Arrow Down: greatest to least

Note: Processing TAT is defined as the time taken from batch creation completed date to processing completed date. Processing complete date is when the activity before QC is completed.
Download Data via CSV
Download all table data within the Global Filtered Date Range by choosing the “Download CSV” option at the bottom of the table.
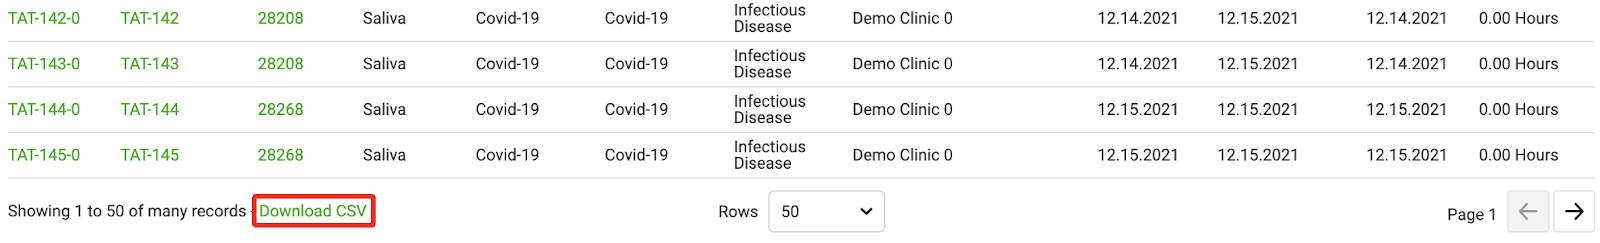
Note: The CSV download will include all data that falls within the Global Filtered Date Range. However, the generated CSV does not include any column sorting or filtering.
Post-Analytical Tab
The Post-Analytical Tab displays all records with an original, signed Report Date that falls within the Global FIltered Date Range. This page contains Post-Analytical Key Performance Indicators (KPIs) and the Post-Analytical Turnaround Time Table
Example Use Cases
The Post-Analytical Tab can be used to help maintain compliance with accreditation entities (ex. CAP) and to understand and support internal operational metrics for improved efficiency. These goals can be met by monitoring monthly, weekly, and daily changes in results from this tab. Monthly, weekly, and daily use cases are listed in the tables below to highlight examples for operational metrics monitoring.
Note: The Metric Calculations in the tables below are all calculated within the selected Global Filters. Changing the Global Filters will alter the calculation results
Monthly, Weekly, and Daily Metrics to Monitor

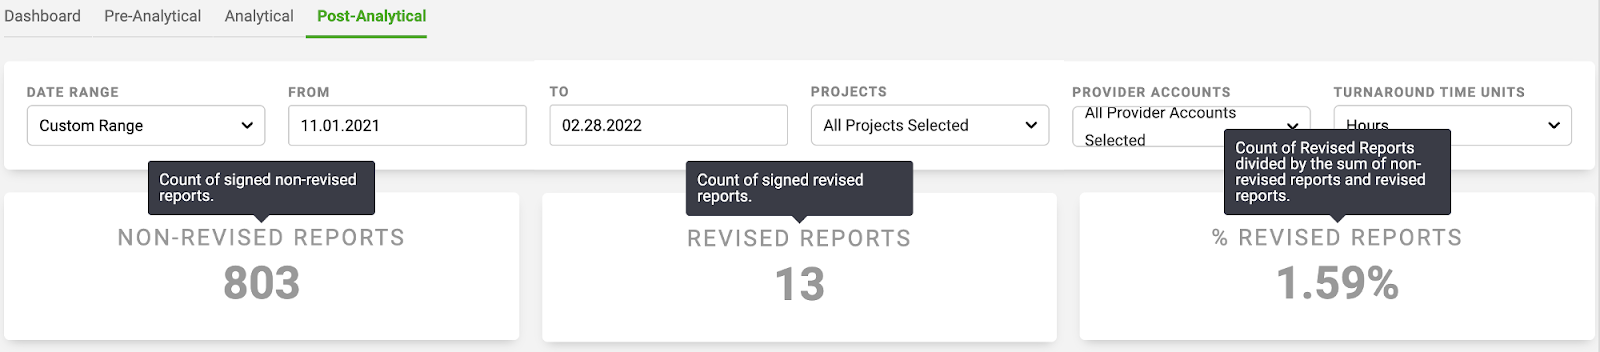
Key Performance Indicators (KPIs)
The KPI boxes at the top of the page are shown below. The Post-Analytical Tab contains the KPIs of NON-REVISED REPORTS, REVISED REPORTS, and % REVISED REPORTS.
Post-Analytical Turnaround Time Table
The Post-Analytical Turnaround Time Table in the middle of the page allows users to filter and sort the data within the Global Filtered Date Range. Within the table, there are column search filters, and sortable columns. Finally, you may export all data via CSV.
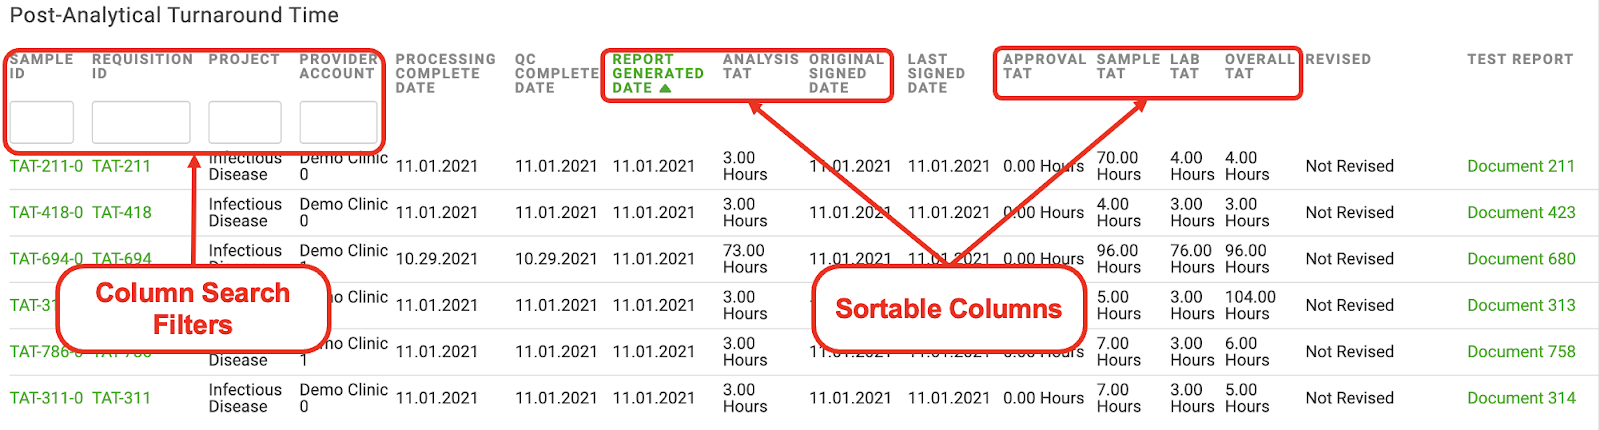
Note: The ORIGINAL SIGNED DATE and LAST SIGNED DATE columns are unique to the Post-Analytical Turnaround Time Table
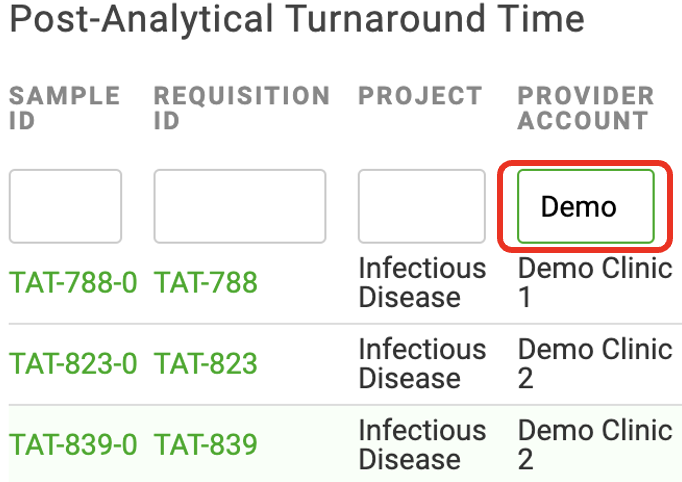
Column Search Filters
Click into the search box for the column you wish to filter and type your search query. The results will automatically reload to display on the screen.
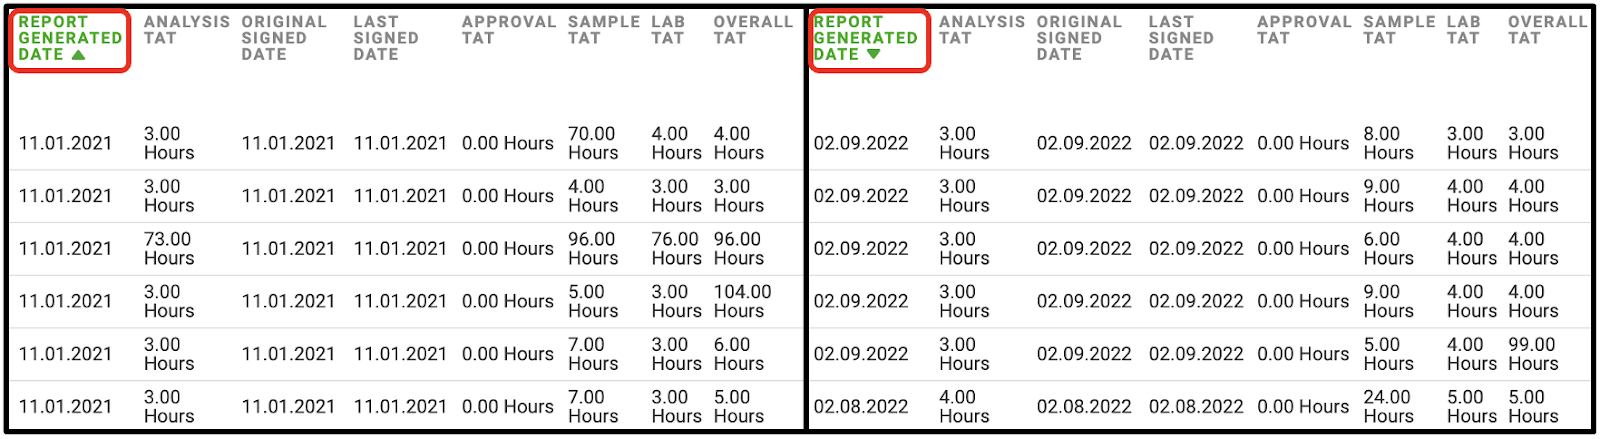
Sortable Columns
There are seven sortable columns in the Post-Analytical Table (see summary table shown below):
1. Report Generated Date
2. Analysis TAT
3. Original Signed Date
4. Approval TAT
5. Sample TAT
6. Lab TAT
7. Overall TAT
Click on the Arrows at the end of the sortable columns for the data to redisplay
- Arrow Up: least to greatest
- Arrow Down: greatest to least
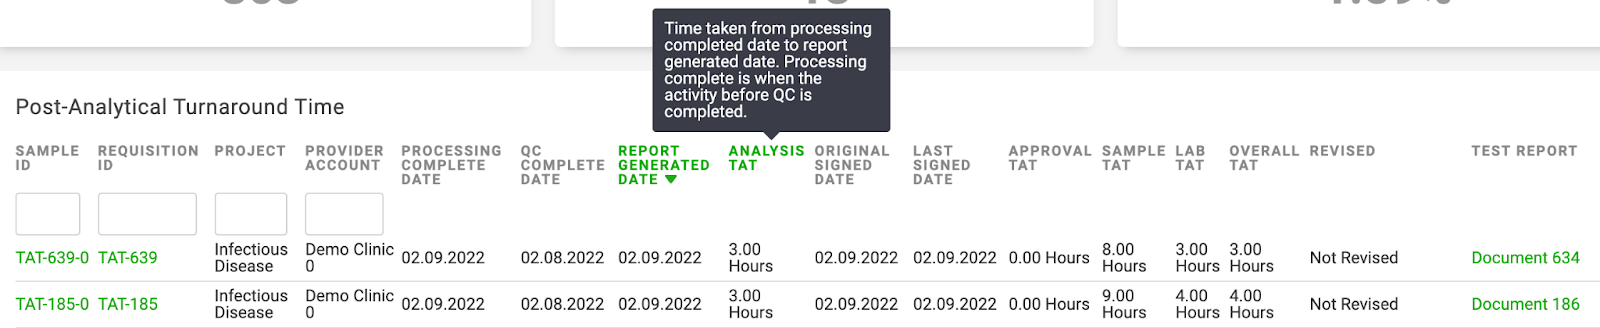
Tip: Definitions for select Sortable Columns can be seen by hovering over the column in question. A summary table is also shown below

Download Data via CSV
Download all table data within the Global Filtered Date Range by clicking the “Download CSV” option at the bottom of the table.
Note: The CSV download will include all data that falls within the Global Filtered Date Range. However, the generated CSV does not include any column sorting or filtering.